How to understand financial statements. An introduction for those not trained in finance or accounting.
All organizations (for-profit businesses and non-profit entities) undertake two primary activities:
- Raise capital from investors; and,
- Allocate that capital to a product or service which is expected to generate a positive return on investment (ideally adjusted for risk and time value.)
These actions (fundraising and capital allocation) as well as the results from these actions are recorded in the financial statements.
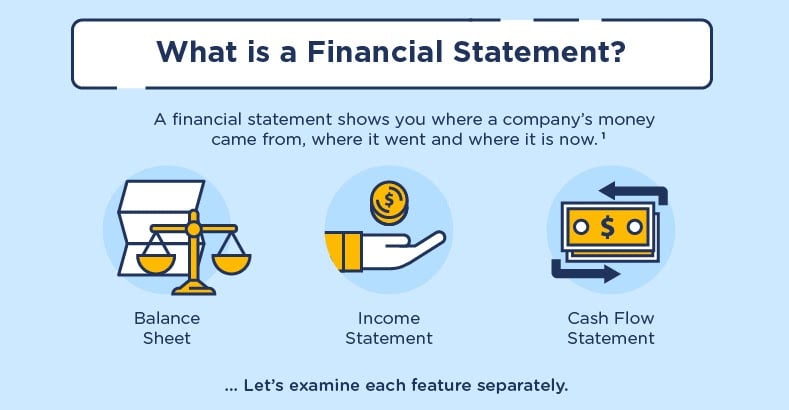
When the term “financial statements” is used it refers to the income statement, balance sheet and cash flow statement.
This piece, Understanding Financial Statements, is the first part of a two-part series. The second part, Analyzing Financial Statements, will help you make greater sense of the financial data.
Why Understanding Financial Statements Matters
Understanding these three financial statements will help all leaders and emerging leaders to better understand the business they are working at. You will gain knowledge to help answer questions such as:
- How is the business performing?
- Is performance improving or worsening
- Does the business have enough cash to survive and grow?
- Is this a high quality business?
Understanding financial statements will also help leaders and emerging leaders ask more relevant and pointed questions of their finance team as well as their peers in the business when it comes to allocating capital. In general, the most important decisions to be made in a business are around allocating capital — for what purpose (hiring, marketing, inventory etc.), how much against each initiative and when (timing.)
(Caveat — before going further, I must stress that there are a lot of nuances in accounting; this essay merely presents an overview and thus necessarily oversimplifies at times.)
Some Important Information for Context
The Accounting Standards or GAAP
Publicly traded companies and many private companies (particularly those that are backed by institutional investors such as venture capital or private equity) use a set of standards called GAAP (Generally Accepted Accounting Principles) to create these financial statements (particularly the Income Statement and Balance Sheet). GAAP differs slightly by country as thus in the US is referred to as US GAAP.
Public Access to Financial Statements
When a publicly traded business reports its quarterly earnings, it files a statement 10-Q (quarterly) or statement 10-K (annually) with the Securities and Exchange Commission (SEC). All financial reports filed by public companies with the SEC can be found here. These filing also include any public data on IPOs or other offerings.
Privately held businesses are not required to make their financial statements available to the public.
Accrual Accounting
It is common to get confused with accrual accounting. So feel free to read this section more than once and look-up alternative explanations. This is important to understand.
One of the core principles of GAAP is “accrual” accounting. Accrual accounting requires recognizing revenue (in the income statement) when the product or service is delivered and recording expenses (also in the income statement) when they are actually incurred.
Often the timing differs between revenue recognition and receipt of cash. Businesses may receive cash in advance of delivering the service or months after the service is delivered. The same applies to expenses — companies may prepay for future expenses or may not be entitled to receive the cash they have invoiced for 60 or 90 days after the invoice is sent.
The balance sheet exists in part to record the reconciling entries that accounts for the difference in timing between when a service is delivered, and cash is received as well as between when an expense is incurred, and the cash is paid out.
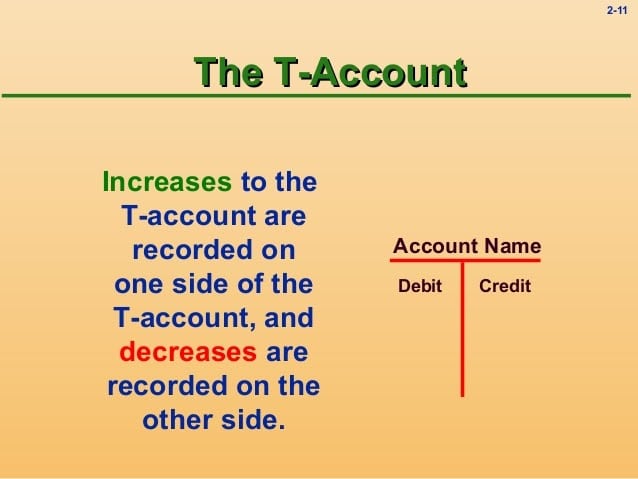
Double Entry Accounting System or The T-Account
As the name implies each accounting entry has two parts to it (hence double.) The two sides of the entry must equal each other in total. Because of the way accounting entries are laid out, they are often referred to as “T-Accounts.”
For example, when a product or service is delivered, the following double entry happens. On one side of the entry revenue increases which flows through to an increase in net income and thus the retained earnings part of equity increases.
On the other side, multiple things could happen. Cash could increase if the payment is made immediately. Accounts Receivable could increase if the customer is invoiced but has not paid yet. Or deferred revenue could decrease if the product or service is a subscription and the initial payment was made in a prior period covering multiple months.
When an expense is incurred, say you buy a pair of shoes, the following double entry happens. One side of the entry is an increase in expense which flows through to decrease in net income thus reducing the retained earnings which reduces equity.
Yet again, on the other side of the entry, multiple things could happen. Cash could decrease if the payment is immediate. The credit card liability could increase if a payment card was used. Or accounts payable or accrued liabilities could increase if you requested to be invoiced for payment in the future.
Cash Accounting — The Exception to Traditionally Accepted Accounting Methods
Small businesses (e.g., sole proprietorships or small partnerships) often use “cash accounting” rather than accrual accounting to maintain their books. I use this accounting method for my consulting business.
Cash accounting is much easier than accrual accounting. It only requires the creation of a single statement — a cash flow statement (which in this case is the same as the income statement). There is no need for a balance sheet.
All bank statements are cash flow statements covering the period indicated in the statement. In your personal or business bank statements, positive quantities indicate inflows of cash while negative quantities show outflows of cash.
Now let’s dive a bit deeper.
The Balance Sheet
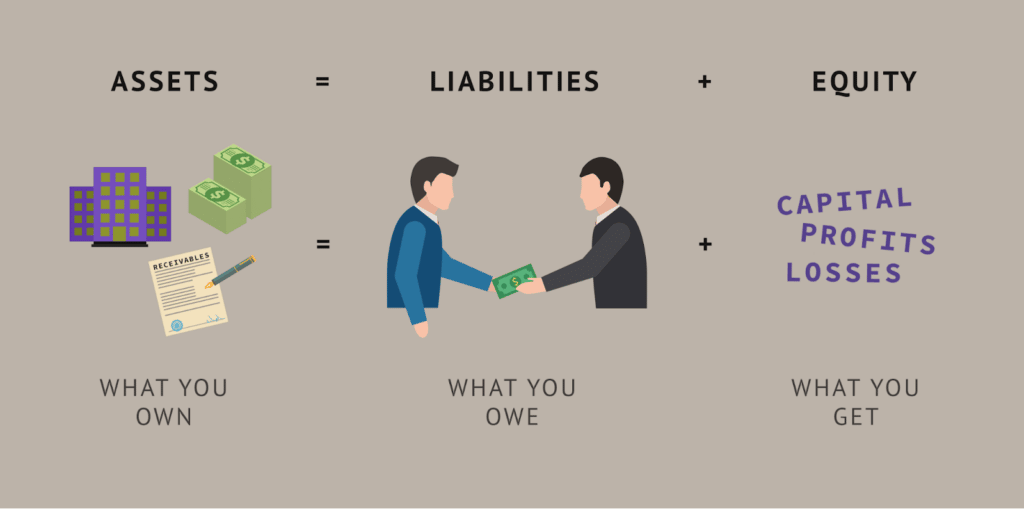
The Balance Sheet records the Assets, Liabilities and Equity of a business.
As the name “balance sheet” suggests the two sides must be equal. The balance sheet is governed by the following equation: ASSETS = LIABILITIES + EQUITY.
The balance sheet is a point-in-time statement. It has an “as of” date. Most commonly this is a month-end date.
The balance sheet lays out the following items:
- Assets: All the amounts belonging to the business held by the business (inventory and PP&E) or held by third parties (primarily receivables from customers and cash in a bank account.);
- Liabilities: All the amounts owed by the business to the third parties (vendors, tax authorities, customers, employees, and lenders.;
- Equity: Typically shown at the bottom of the Liabilities side of the balance sheet. Equity is the difference between the value of the Assets and the Liabilities. It belongs to the shareholders.
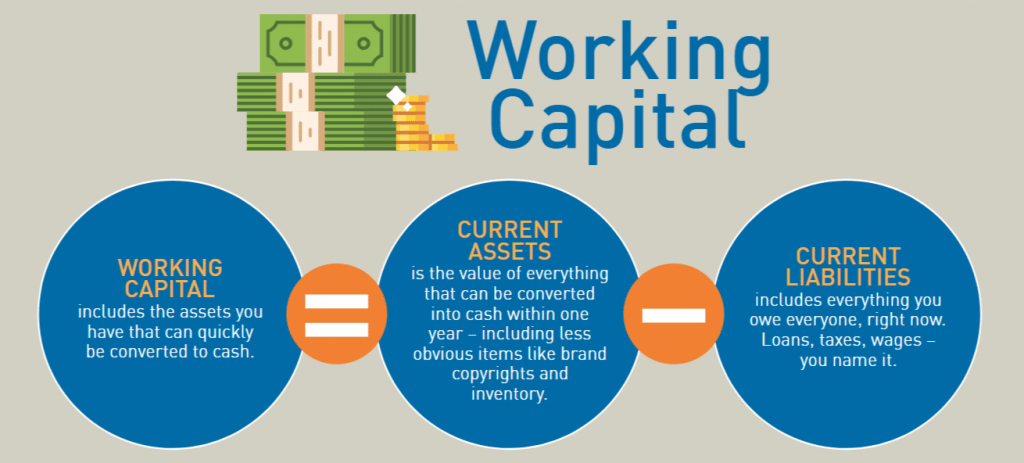
Working Capital
A sizable portion of the assets and liabilities recorded on the balance sheet are short term (also called “current”.) From an accounting standpoint, short term means that liabilities must be paid, or assets are expected to be collected or utilized in less than 12 months.
These short-term amounts collectively are often referred to as Working Capital. Working capital represents the investment in the business required to fund operations on a short-term basis. All businesses have working capital requirements.
Net Working Capital is equal to the Current Assets minus the Current Liabilities.
Investors and finance team members may refer to business as having “negative” or “positive” working capital. Negative working capital businesses are those where current liabilities exceed the current assets. Put another way, this means that third parties are willing to lend the business money to finance its growth. This is one of the reasons that investors value SaaS businesses with contracts paid annually in advance so highly. Contracts paid annually in advance help create negative working capital, where customers are providing at least some of the capital to finance the growth of the business.
Assets – The Primary Accounts
- Cash. Sometimes called Cash and Cash Equivalents, this is the sum of the cash and liquid securities (if any) in all the different bank or brokerage accounts belonging to the business.
- Short-Term (or Current) Assets. This category contains various accounts including:
- Accounts Receivables. Amounts invoiced and owed by third parties to the business.
- Inventory. Applicable to businesses dealing in physical products. Inventory includes finished goods in a warehouse, in transit and work-in-process.\
- Prepaids. Amounts paid in advance of the full delivery of the service. This could be for a future event or for an annual subscription to something where the business has not yet received the entire service.
- Fixed Assets. Sometimes called PP&E (Property, Plant and Equipment). This encompasses any long-lived asset that will offer value to the firm for more than 1 year. These are a category of long-term assets but reportedly separately. These could be items such as:
- Land and Buildings or Factories;
- Equipment (tools or computers);
- Furniture and Fixtures (desks, chairs etc.).
Each asset is determined to have a useful life in years or months. Then, each period (month, quarter, or year) of the income statement is burdened with the pro-rata amount of expense related to the useful life of this asset for that period.
This expense is called depreciation and is accumulated on the balance sheet as a contra asset (or negative asset) in the Fixed Asset category.
Any purchase of a fixed asset leads to an increase in the PP&E account, while any sale of a Fixed Assets reduces the value of this account.
- Long-Term Assets. These are assets that belong to the company whose value will be realized in longer than 1 year. One example is a security deposit associated with an office lease which will be released after more than 1 year. Another example of a long-term asset is an intangible asset (something which cannot be touched, as opposed to a traditional fixed asset which is tangible.) Intangible assets would include things such as brands, trademarks, patents, customer lists etc. which have long-term value.
Liabilities – The Primary Accounts
- Short-Term (or Current) Liabilities. This encompasses a large group of items which are assigned separate accounts. It pertains to all amounts owed that would be due within the next year. Examples of short-term liabilities would include:
- Account Payable. Invoiced amounts owed to vendors.
- Credit Card Liabilities. Amounts charged on credit cards and not yet paid off.
- Accrued Expenses. Costs incurred which have not yet been billed but will be in the future.
- Accrued Bonuses and Commissions. The portion of bonuses/commission earned to date which are expected to be paid in the future.
- Tax Liabilities. Amounts owed for income tax, sales tax or for other taxes.
- Unearned or Deferred Revenue. This relates to any subscription revenue where the customer has paid for multiple periods (i.e., greater than 1 month). The portion on the balance sheet relates to the value of the service to be delivered in future periods.
- Other Accrued Liabilities. Other expenses incurred to date and not yet paid which will come due in the next 12 months.
- Short Term Debt. Principal to be repaid within the next 12 months.
Certain liabilities may be split between short-term and long-term components. For example, with regard to debt owed to third parties, some amount of principal may be due in the next 12 months (and would be classified as a short-term liability), while the rest would be categorized as a long-term liability.
- Long-Term Liabilities. Long-term relates to amounts owed to third parties which are due in more than 12 months. The most common item in this category is debt owed to third parties.
- Equity. The equity amount represents the amount that belongs to all shareholders. This account reflects all the equity issued by the business. It could be to founders at a very low price per share or to public investors at a much higher IPO price per share. Also included in the equity is the cumulative losses or profits of the business since foundation.
The Income Statement
This is sometimes referred to as the Profit and Loss Statement or the P&L. Income statements span a period of time (a month, a quarter, or a year.)
Income statements generally have the following structure.
- Revenue
- Cost of Goods Sold
- Operating Expenses
- Other Income and Other Expense
Revenue
This shows the amount earned in that period for the product(s) sold and service(s) delivered. Often revenue is split by primary categories – (i) software and services in SaaS; (ii) product and shipping in e-commerce.
Sometimes there are negative revenue entries to reflect things such as discounts (e.g., spend over $100 and get 10% off the entire order) and returns (products returned to the company by customers.)
Cost of Goods Sold
This is all the cost incurred to deliver the product or service to the customer.
In SaaS it includes items such as (i) hosting costs (AWS, Azure, Google Cloud etc.) and (ii) Customer Service Costs – the people, software, and related costs to serve customers, answer questions, and keep them using the software.
In e-commerce it includes items such as (i) Product costs; (ii) Shipping costs; (iii) Warehouse costs; (iv) Customer service costs, and (v) Payment processing costs.
Gross Profit
This figure represents Revenue minus Cost of Goods Sold.
Gross margin is the % calculated when Gross Profit is divided by Revenue. A high gross margin % means the cost to deliver the product or service is low. SaaS gross margins are often 70-80% while e-commerce gross margins are more typically 45-55%.
Operating Expenses
Most companies will split operating expenses into three primary categories.
- Sales & Marketing. S&M includes all the payroll costs associated with those employees in the sales, marketing, account management and similar departments. It would also include all consultants who provide services to this function as well as software, T&E and other costs (e.g., training, employee morale, and recruiting spend) to support these departments.
- Research and Development. R&D includes all the payroll costs associated with those employees in departments commonly referred to as Engineering, Product and Design. It also includes all consultants who provide services to this function, as well as software, T&E and other direct costs (e.g., training, employee morale, and recruiting spend) to support these departments.
- General & Administrative. G&A includes all the payroll costs associated with employees in the following functions – finance, HR, legal, administrative, and executive. It also includes certain company wide costs that are not allocated to a specific department such as corporate insurance, professional services expenses (legal, accounting etc.,) rent and utilities, and office expenses among others. Finally, G&A also includes any consultants who provide services to this function as well as software, T&E and other costs (e.g., training, employee morale, and recruiting spend) to support these departments. Sometimes stock compensation expense is also included in G&A when it is challenging to allocate it explicitly to each of the other departments.
EBITDA
The acronym stands for Earnings before Interest, Taxes, Depreciation and Amortization. EBITDA is calculated as the Gross Profit minus the total Operating Expenses.
Though almost always reported by public companies in their filings and conversations with analysts, EBITDA is not a GAAP metric accepted by the SEC.
EBITDA became a popular metric on Wall Street (by stock analysts and bankers engaged in M&A deals) to compare companies because it attempts to normalize for several non-operating variables including capital structure (i.e. interest), jurisdiction/regulation (i.e. taxes), past investment (i.e. depreciation and amortization).
Other Income and Other Expenses
This category generally includes items such as:
- Interest income and interest expense;
- Depreciation and Amortization; and,
- Any true-ups due to foreign exchange rate fluctuations.
Pre-Tax and Net Income
Subtracting other income and expense from EBITDA leaves you with Pre-tax Income.
Many early-stage or high growth businesses lose money (i.e. have a negative pre-tax income). These businesses do not pay income taxes and hence pre-tax income is the same as net income.
This net income figure for a given period is added to the retained earnings part of the Equity section of the balance sheet.
The Cash Flow Statement
In my opinion, this statement is far more important than the income statement and often underappreciated.
The cash flow statement reconciles the differences between the income statement and the balance sheet to show how much cash the business generated or spent in a period.
It is possible to create a cash flow statement for a period by having the start of the period and end of the period balance sheets.
As a rule of thumb, the change in any item on the balance sheet must have an entry in the cash flow statement.
Cash flow statements typically have the following structure.
- Net Income. The starting point.
- Non-cash Items. These are added back and include items such as:
- Depreciation and amortization
- Stock compensation expense
- Non-cash interest expense (some securities charge a pay-in-kind or PIK interest)
- Changes in the Working Capital Accounts (on the balance sheet). These changes can be negative (a use of cash) or positive (a source of cash).
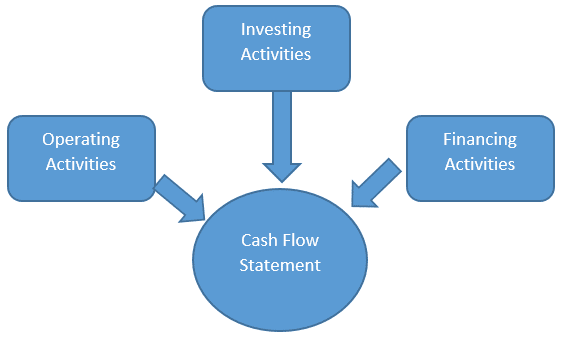
The sum of these three items above is typically called Cash Flow from Operations (or from Operating Activities.)
- Investing Activities. This typically includes purchases (and infrequently the sale) of capitalized equipment (or PP&E). Sometimes other costs might be capitalized and reflected here such as a portion of R&D expenses to build a product with a long-term life.
- Financing Activities. This includes cash received or paid from the following activity:
- Issuance or repurchase of stock
- Dividend payments
- Issuance or repayment of loans
- The exercise of options
The sum of these five (5) items above equals the cash generated (if positive) or used (if negative) by the organization in the period under consideration.
This change in cash (positive or negative) is then added to the cash at the start of the period (shown on the opening balance sheet) to calculate the cash at the end of the period (shown on the closing balance sheet.)
In Conclusion
While the cash flow statement is probably the most important, one should look at all three statements together. As the cash flow alone does not provide enough detail or context to understand the business.
Understanding this basic overview of financial statements will enable you to look at the financials of any organization and be much better positioned to understand the performance of the business.
Pair this knowledge with the concepts laid out in the article to be published next as How to Analyze Financial Statements and you will be well positioned to truly evaluate the relative strengths and weaknesses of any business.
Want More Education Like This?
Join our community of like-minded professionals interested in learning and development who support each other.