How to analyze financial statements and make sense of the data
“Data! data! data!” he cried impatiently. “I can’t make bricks without clay.”
— Sherlock Holmes in The Adventure of the Copper Beeches
Picture this. As part of evaluating a new organization to join or in the first few weeks of a new role, you are presented with a company’s financial statements or budget.
You have been asked to develop a point of view on the business. At first glance, all you see are a lot of numbers.
This piece is intended to help you derive some insight when reviewing financial statements.
I will offer a framework for analyzing financial data using metrics and ratios.
Even if your functional responsibility is in human resources or sales or engineering, being able to analyze financial statements will make you a more valuable employee and better leader. Equally importantly you will be better able to judge how the business you work at or are considering working at is performing. And thus, allow you to make more informed decisions.
(This is the second article in a two-part series that began with How To Understand Financial Statements.)
What Does Analyzing Financial Statements Allow You to Do?
Financial statement analysis involves the creation of common size ratios, often called metrics or key performance indicators (KPIs).
These financial ratios are useful in the following ways.
- Benchmark Performance. The best way to compare broadly similar companies in a financial sense is on metrics such as growth rates, margins etc. rather than actual $$ of revenue or the amount of capital raised (the latter being the most frequently disclosed metric for venture-backed companies.)
- Visualize Trends. Any single point of financial data is not particularly useful. Seeing the trend over a few months, quarters or years is a lot more interesting. A trend line that shows a ratio or metric improving rapidly over time is a lot more appealing than the same trend line being flattish.
- Create a Forecast. Forecasting future business performance is a complex task and worthy of one or several separate articles. Suffice it to say that calculating and analyzing financial ratios over a period is a critical input in any forecast.
Aren’t There a Lot of Metrics?
Yes, there exist a vast array of financial metrics. In addition to pure financial metrics there are other ratios or metrics that combine financial data with operating data (such as revenue per employee or average revenue per customer to name a couple.)
The best way to get a thorough sense of the quality of a business and its prospects is to evaluate both pure financial metrics and operational metrics.
This article is intended to present just an overview of the most discussed financial metrics. I am focusing on financial metrics as they tend to be much more standard across businesses, while operating metrics are often tailored to the specific individual business.
Income Statement Metrics and Cash Flow Statement Metrics
Recall that both income and cash flow statements display performance over a period. In public filings, companies are required to present three years of income statement and cash flow statement data.
Growth Rates
Growth rates are first and second derivatives (hopefully you are not too scared by high-school calculus.)
The first derivative is the rate of change (and direction of change). The higher the growth rate, the faster the rate of change. And if revenue is dropping, then the growth rate is negative as happened to most hospitality businesses during COVID.
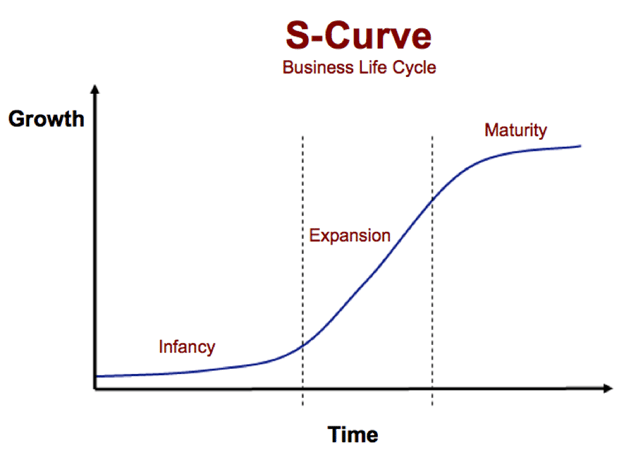
The second derivative calculates how fast the “change itself” is happening. The second derivative answers the question, “is growth speeding up, flat or slowing down?”
You may well have seen this image below (the classic “S-Curve”) applied to all new technologies as they are adopted. Growth is speeding up just before and into the early part of the expansion phase. Growth is flat (albeit high) during the middle of the expansion phase. Growth is slowing and low during the maturity phase.
Common growth rates calculated when analyzing financial statements include:
- Comparable period growth rate (year over year). The most common growth rate metric. This compares the current period (say Q3 2021) against the same period in a prior year (e.g., Q3 2020). This growth normalizes for any seasonality effects and shows the growth of a business over a year.
- Sequential growth rate. This is the growth rate from one period to the next. The periods used can be weeks, months, or quarters.
- CAGR (Compound Annual Growth Rate). The CAGR is the average growth rate compounded over a long period of time, usually 3+ years. This is often used when presenting multi-year forecast models for a business.
Margins or “Profitability” Ratios
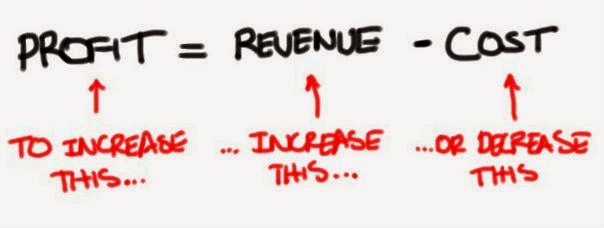
Margins are another name for profitability ratios or how much of a particular type of profit results from a given amount of revenue. Margins are expressed as percentages.
You’ve likely heard of the aphorism attributed to Jeff Bezos, “Your margin is my opportunity.” The meaning of this statement is that Amazon views a profitable sector (one with high margins) as offering them an opportunity to build a business and gain market share while reducing pricing and improving customer experience.
The common margins computed when analyzing financial statements include:
- Gross Margin. This is the Gross Profit (revenue minus cost of goods sold) divided by Revenue. This represents the profit after the direct cost to serve customers.
- EBITDA Margin. This is earnings before interest, taxes, depreciation, and amortization (or Gross Profit less total cash Operating Expenses) divided by Revenue. This is sometimes called the operating cash flow margin. It indicates the profitability of a business after all the operating business costs are considered.
Cash Conversion
I mentioned in the first part of this series that I believe the most important financial statement is the Cash Flow Statement. The margins above are used to gauge the “profitability” of a business. However, they don’t indicate the amount of cash produced by a business. Hence, I encourage calculating “cash conversion” ratios as well.
- EBITDA minus Capex. As discussed in the first article of this series, capital spending is a financial metric that shows up on the balance sheet and the cash flow statement (but not the income statement.) The income statement only contains the pro-rata depreciation expense for that period.
- Some businesses have high EBITDA margins but require a lot of regular capital spending (e.g., mobile service provided such as Verizon or cable television providers such as Comcast.) Other businesses have lower EBITDA margins but much less or almost zero capital spending (e.g., software or data businesses.)
- Calculating EBITDA minus Capital Expenditures allows you to know how much cash generated per the income statement (EBITDA) is cash after the required investment is made (capital spending).
- Free Cash Flow. Often also called Free Cash Flow before Financing (see prior piece on Understanding Financial Statements to see how that is calculated). This considers the working capital needs of the business and capital spending. Dividing Free Cash Flow (before Financing) by Revenue shows how much of revenue generated is converted into cash that can be reinvested in new growth opportunities for the business or paid out to shareholders.
Balance Sheet Metrics
The balance is a point-in-time statement. All balance sheet metrics reflect the state of the business at a given point in time.
Short-Term Liquidity.
When people refer to “liquidity” in a financial context, they mean how much “cash” an organization has. I say “cash” in inverted commas because this definition includes assets that can be quickly converted into cash (typically accounts receivable and marketable securities) without materially affecting the price of these assets.
- Current Ratio. Defined as Total Current (Short-Term) Assets divided by Total Current (Short-Term) Liabilities. Many financial analysts like to see this ratio > 1.0 which means the organization can pay its liabilities fully.
- Quick Ratio: This is a more conservative metric of liquidity. It is defined as Cash plus Accounts Receivable divided by Current Liabilities.
Cash Conversion Cycle.
The cash conversion cycle measures the time (in days) that it takes between spending cash to create revenue and the time that cash from that revenue is collected. This metric is particularly relevant to businesses that supply physical goods.
Businesses that have low cash conversion cycles can grow rapidly (assuming demand exists) while requiring less cash to fund that growth than businesses which have high cash conversion cycles.
Amazon is said to have a negative cash conversion cycle (meaning they collect money from customers before paying for their inventory).
The word “turnover” is used in the definitions below to describe the concept of supplies being replaced (or turned over).
- Accounts Receivable Turnover Days. This is sometimes called days sales outstanding or DSOs. It is calculated as the average of the accounts receivable between two-month ends divided by sales in that month * 30 (days in the average month.) For SaaS business models, I recommend using monthly billings in the numerator rather than monthly sales or revenue.
- Inventory Turnover Days. Calculated as average inventory between two-month ends divided by total product cogs in that month * 30 (days in the average month.)
- Accounts Payable Turnover Days. Calculated as the average accounts payables outstanding between two-month ends divided by the total product cogs in that month (assuming these were bought on credit) * 30 (days in the average month.)
In summary, the Cash Conversion Cycle = AR Days + Inventory Days – AP Days
Leverage or Capital Structure
The capital structure refers to different sources and types of financing a business secures to fund its growth. The term leverage is used to explain how capital belonging to a third party (typically a lender) has been borrowed to help create a business. Put another way, some amount of equity (invested by the people taking the primary risks) plus borrowing (or leverage) allow a business to grow in a manner that would not be possible otherwise.
Some businesses which have assets with relatively stable and clearly identifiable value (real estate being the prime example) can be funded with a large portion of debt. These businesses are “highly leveraged.” When asset values go up somewhat great wealth can be created; when asset values decline a similar amount the result can be insolvency and bankruptcy. These are the boom-and-bust cycles that characterize real estate and other leveraged bets.
Other businesses that are more speculative (for example new drug development) must rely almost entirely on equity financing (or sometimes grants.)
- Net Debt. Calculated as total debt (short term and long term) minus cash. Typically, businesses that are losing money (and growing) tend to have little or no debt. By contrast businesses that are more mature (slower growth) and generate substantial cash flow tend to have significant debt.
- Net Debt to Total Capital Raised. The ratio reveals how much debt (or leverage) has been used to fund a business. Businesses that use a lot of debt must either be able to tap the capital markets (to refinance such debt) or be generating a lot of free cash flow to service the debt. Adding debt typically adds risk to a business, even as it reduces the cost of capital (debt is usually a lot cheaper than equity because it gets paid back first before payments to equity holders.)
Combined Income Statement and Balance Sheet Metrics
Rates of Return or Efficiency Metrics
Rates of return are a measurement of the quality of an investment. It is the standard way all of us would evaluate the return on our 401(k) or investment portfolio. Rates of return allow us to judge by how much the value of an investment is increasing.
- Return on Equity. This metric shows the return earned by a business that accrues to the shareholders. The calculation is net income in a period divided by average shareholders’ equity over the period.
- Return on Assets. This metric is meant to show the “earnings” available to pay back all the “funders” of the business (lenders, vendors, and shareholders). There are a few different metrics used in the numerator. I prefer to use operating income (or earnings before interest and taxes) divided by the average total assets over the period in question. If the business is highly capital intensive, I might suggest using EBITDA less maintenance capital spending as the numerator instead.
Which Metrics Matter the Most?
So, amongst this laundry list of financial metrics, what is the most important one? After all, in business and life we like to simplify things. Having simply one metric to monitor would be a lot easier.
There is no “right” answer to this question. If I were asked this question, I would suggest two metrics (not one.) My mix would include an efficiency metric and a growth metric. Having one without the other makes it very challenging to have a successful business.
For higher growth, earlier-stage businesses I would recommend return on equity and revenue growth.
For lower growth, later-stage businesses, I would look at return on assets and EBITDA growth.
Caveat Emptor or Buyer Beware
One final overarching piece of advice. Always approach financial data with a healthy degree of skepticism.
The person presenting the information to you (the “seller”) always has more information that you do. The asymmetry of information is working against you before you begin any analysis. The starting point for any set of financial data and especially metrics can have a significant influence on how appealing the statistics presented appear.
Want More Education Like This?
Join our community of like-minded professionals interested in learning and development who support each other.